Details of data processing:
Plant materials
A diverse worldwide collection of 533 O. sativa accessions including both landraces and elite varieties was obtained, including 200 varieties from a core/mini-core collection of Oryza sativa L. in China, 132 parental lines used in the International Rice Molecular Breeding Program, 148 varieties from a mini-core subset of the US Department of Agriculture rice gene bank, 18 varieties used for SNP discovery in the OryzaSNP project and 35 additional worldwide rice germplasm obtained from the Rice Germplasm Center at the International Rice Research Institute. Sequences of 950 accessions generated by Huang et al. (2012, Nat. Genet. 44:32-39) were downloaded from the EBI European Nucleotide Archive with accession number ERP000106 and ERP000729. Information about the accessions, including variety name, country of origin, longitude and latitude origin and subpopulation identity, can be queried in Cultivar Information page.Sequence alignment and SNP/INDEL identification
The assembly release version 6.1 of genomic pseudomolecules of japonica cv. Nipponbare was downloaded from Michigan State University and used as the reference genome. Reads of all varieties were aligned to the pseudomolecules using the software BWA61. SNPs/INDELs were identified using SAMtools and BCFtools. Only alignments with mapping quality ≥40 were used, and bases with base quality ≥10 were used to identify SNPs (with parameters of -C50 -Q10 -q40 for the mpileup subcommand of SAMtools). The SNPs identified by BCFtools were further filtered: only a SNP with the proportion of heterozygous genotype called by BCFtools of less than 0.1 and the average depth for a variety (calculated by dividing the overall depth by the number of varieties) between 0.2 and 2.5 were considered. A total of 8,044,699 SNPs were identified. Some SNPs appeared to have three or more alleles, which might due to sequencing errors. We only considered a candidate SNP if, when sorting the alleles in descending order of supporting reads, the total number of reads supporting the third and fourth alleles was less than half of the number supporting the second allele, as well as less than ten, in which case only the first two alleles were retained; other alleles were considered sequencing errors and set to missing. Only SNPs with the number of varieties with minor allele greater than five in the whole 1,483 variety population and at least 20% varieties genotyped were considered as high-quality SNPs. Finally, we obtained 6,551,358 high quality SNPs. In the first set of 533 accessions, three were found with excessive heterozygosity and one with low mapping rate, which were excluded in further analysis.Imputing missing genotype using an LD-KNN algorithm
After obtaining raw genotype calls from BCFtools, 47.1% of genotypes was missing due to low-coverage sequencing. We then performed imputation using an in-house modified k nearest neighbour algorithm. Four varieties with apparent heterozygosity were excluded in the imputation analysis, and the remaining heterozygous calls were set to missing. Only SNPs polymorphic in the remaining 529 varieties were selected for imputation. The performance of KNN imputation is determined by a number of features, including the probability of successfully identifying k-nearest neighbors and how similar the target sample is to the neighbors. To increase the performance of KNN imputation, we merged all 1,479 rice varieties together for the imputation. Briefly, we first obtained initial imputation genotypes of the missing genotypes using a classic KNN algorithm with relaxed parameters. Then, for each SNP, the 100 SNPs upstream and downstream were selected, and the r2 of LD was calculated. A threshold was selected to screen high-LD SNPs, and then the KNN algorithm with strict parameters was carried out and the final imputation genotype was determined. Because we used strict parameters, after a round of LD-KNN imputation, there were still a lot of missing genotypes. The LD-KNN imputation was run several times iteratively to reach user requirement. Parameters with window size of 100 SNPs, k-nearest of five SNPs, f = 1, s =-7, r2 = 0.09 and five iterations were selected to perform imputation in our study. After imputation, for the 6,551,358 SNPs, we got an overall missing data rate reduced to 0.42%. We further selected SNPs with rate of missing data less than 20% of the accessions resulting in a total of 6,428,770 SNPs, with the overall missing data rate about 0.38%. These SNPs were used to carry out GWAS.Data evaluation:
We estimated the recall rate of SNP identification from five datasets, and all results show that the 6,551,358 SNPs cover over 91.8% of SNPs so far identified in rice (Table 1). The 14-fold Illumina sequences of Zhenshan 97B and Minghui63 are available in NCBI Sequence Read Archive with accession number SRA012177. Three SNP sets were derived from pairwise comparisons of Zhenshan 97B, Minghui63 and reference genome Nipponbare using SAMtools and BCFtools, respectively. Two SNP sets, 157,058 SNPs from OryzaSNP project and 36,901 high quality SNPs from rice 44K SNP array, were downloaded from Gramene (http://gramene.org/diversity/download_data.html).
To estimate the accuracy of imputed genotype, we genotyped 48 accessions using Illumina Infinium array RiceSNP50. There are 43386 high quality SNP markers in the array and 42759 (98.6%) SNPs covered by the 6,428,770 well-imputed SNPs. The accurary of Infinium array is proved. Thus, the concordance of genotypes using array hybridization and sequencing can be used to estimate the accurary of raw genotypes from direct sequencing and after imputation. The results suggested an accuracy of 99.8% for raw genotypes and 99.3% for genotypes after imputation (Table 2).
Table 1. Recall rates of five SNP sets against 6,551,358 high quality SNPs of which the minor allele appears in at least five accessions.
| Comparison | Num. SNPs | Num. recalled SNPs | Recall rate |
|---|---|---|---|
| Nipponbare/Minghui 63 | 1258436 | 1172123 | 93.14% |
| Nipponbare/Zhenshan 97B | 1245925 | 1162072 | 93.27% |
| Minghui 63/Zhenshan 97B | 572527 | 525618 | 91.81% |
| OryzaSNP | 157058 | 145508 | 92.65% |
| Rice44k | 36901 | 35680 | 96.69% |
To estimate the accuracy of imputed genotype, we genotyped 48 accessions using Illumina Infinium array RiceSNP50. There are 43386 high quality SNP markers in the array and 42759 (98.6%) SNPs covered by the 6,428,770 well-imputed SNPs. The accurary of Infinium array is proved. Thus, the concordance of genotypes using array hybridization and sequencing can be used to estimate the accurary of raw genotypes from direct sequencing and after imputation. The results suggested an accuracy of 99.8% for raw genotypes and 99.3% for genotypes after imputation (Table 2).
Table 2. Concordance between genotyping results of array hybridization and sequencing on 42759 SNPs.
| ID | | | ||||
|---|---|---|---|---|---|---|
| Num. Concordance | Num. Difference | Prop. Concordance | Num. Concordance | Num. Difference | Prop. Concordance | |
| C137 | 36808 | 43 | 0.998833 | 41739 | 146 | 0.996514 |
| C143 | 34911 | 124 | 0.996461 | 40659 | 419 | 0.9898 |
| C123 | 36634 | 34 | 0.999073 | 41582 | 187 | 0.995523 |
| C006 | 35121 | 120 | 0.996595 | 40584 | 443 | 0.989202 |
| C094 | 33592 | 100 | 0.997032 | 40539 | 447 | 0.989094 |
| C056 | 37195 | 10 | 0.999731 | 42248 | 99 | 0.997662 |
| C043 | 34737 | 98 | 0.997187 | 40845 | 404 | 0.990206 |
| C131 | 34655 | 121 | 0.996521 | 40587 | 455 | 0.988914 |
| C135 | 35296 | 174 | 0.995094 | 40747 | 479 | 0.988381 |
| C005 | 36855 | 51 | 0.998618 | 41505 | 213 | 0.994894 |
| C110 | 34568 | 122 | 0.996483 | 40572 | 465 | 0.988669 |
| C140 | 34618 | 97 | 0.997206 | 40528 | 394 | 0.990372 |
| C041 | 35093 | 87 | 0.997527 | 40764 | 400 | 0.990283 |
| C038 | 35183 | 111 | 0.996855 | 40607 | 408 | 0.990052 |
| C028 | 37893 | 23 | 0.999393 | 42154 | 114 | 0.997303 |
| C025 | 34681 | 130 | 0.996266 | 40723 | 402 | 0.990225 |
| C144 | 36774 | 30 | 0.999185 | 41785 | 161 | 0.996162 |
| C120 | 37714 | 20 | 0.99947 | 42262 | 101 | 0.997616 |
| C134 | 37211 | 109 | 0.997079 | 41698 | 236 | 0.994372 |
| C124 | 34098 | 101 | 0.997047 | 40599 | 405 | 0.990123 |
| C148 | 34376 | 111 | 0.996781 | 40780 | 380 | 0.990768 |
| C027 | 35055 | 111 | 0.996844 | 40862 | 396 | 0.990402 |
| C091 | 33896 | 103 | 0.99697 | 40811 | 443 | 0.989262 |
| C037 | 34992 | 133 | 0.996214 | 40670 | 441 | 0.989273 |
| C096 | 33733 | 126 | 0.996279 | 40426 | 419 | 0.989742 |
| C129 | 34101 | 138 | 0.99597 | 40505 | 455 | 0.988892 |
| C074 | 36182 | 35 | 0.999034 | 41585 | 185 | 0.995571 |
| C114 | 34291 | 100 | 0.997092 | 40618 | 401 | 0.990224 |
| C113 | 34759 | 95 | 0.997274 | 40674 | 376 | 0.99084 |
| C052 | 36930 | 14 | 0.999621 | 42075 | 107 | 0.997463 |
| C040 | 34886 | 109 | 0.996885 | 40722 | 418 | 0.98984 |
| C002 | 36096 | 47 | 0.9987 | 40765 | 216 | 0.994729 |
| C003 | 37070 | 24 | 0.999353 | 41385 | 182 | 0.995622 |
| C065 | 34054 | 102 | 0.997014 | 40570 | 435 | 0.989392 |
| C026 | 36751 | 27 | 0.999266 | 42213 | 118 | 0.997212 |
| C103 | 36364 | 23 | 0.999368 | 41719 | 163 | 0.996108 |
| C050 | 34500 | 99 | 0.997139 | 41079 | 370 | 0.991073 |
| C064 | 36754 | 20 | 0.999456 | 42051 | 124 | 0.99706 |
| C029 | 36971 | 41 | 0.998892 | 41805 | 177 | 0.995784 |
| C054 | 36828 | 17 | 0.999539 | 42018 | 132 | 0.996868 |
| C149 | 37072 | 17 | 0.999542 | 42195 | 94 | 0.997777 |
| C067 | 36327 | 24 | 0.99934 | 41734 | 169 | 0.995967 |
| C106 | 36821 | 38 | 0.998969 | 41782 | 174 | 0.995853 |
| C101 | 35957 | 22 | 0.999389 | 41737 | 174 | 0.995848 |
| C060 | 34266 | 104 | 0.996974 | 40775 | 429 | 0.989588 |
| C063 | 36595 | 24 | 0.999345 | 42157 | 126 | 0.99702 |
| C048 | 37636 | 17 | 0.999549 | 42085 | 108 | 0.99744 |
| C042 | 34557 | 104 | 0.997 | 40785 | 433 | 0.989495 |
| Total | 1711457 | 3530 | 0.99794 | 1979310 | 14023 | 0.99296 |
The genetic structure and diversity of the rice germplasms:
The population structure of the 1479 accessions was inferred using ADMIXTURE based on 188,637 SNPs with even distribution sampled from the 6,428,770 well-imputed SNPs (missing data ≤20%). In SNP selection, we divided the genome into ~3.8 kb regions, at most two SNPs with minor allele frequencies (MAF) ≥0.01 were randomly chosen for each region. Parameter of the number of ancient clusters K was set from 2 to 7 to obtain different inferences. Each accession was classified based on its maximum subpopulation component. Accessions with the maximum subpopulation component value differing from the secondary value less than 0.4 were classified as intermediate.
When K=2, accessions were divided into indica and japonica varietal groups.
At K=3, the aus cluster (Aus) appeared within the indica varietal group.
At K=4, the indica were further divided into two sub groups (indica I and indica II, also denote as IndI and IndII), indica accessions with similar components of IndI and IndII (<0.4) were classified as Indica Intermediate.
At K=5, japonica were divided into two sub groups, corresponding to tropical japonica (TrJ) and temperate japonica (TeJ), japonica accessions with similar components of TeJ and TrJ (<0.4) were classified as Japonica Intermediate.
At K=6, an independent group (VI) emerged, which is an intermediate group between indica and japonica. Only fourteen accessions belonged to VI and we found that nine of them were with mutated fragrance gene fgr, which suggested that VI is corresponding to Group V/Aromatic group reported in other studies (Glaszmann et al. Theor Appl Genet, 1987, 74: 21-30; 1. Garris et al. Genetics, 2005, 169: 1631-1638).
The set of 529 rice accessions sequenced in this study was accordingly classified into 98 IndI, 105 IndII, 92 indica intermediate, 91 TeJ, 44 TrJ, 21 japonica intermediate, 46 Aus, 14 VI, and 18 intermediate, and the set of 950 rice accessions sequenced by Huang et al. was divided into 283 IndI, 111 IndII, 120 indica intermediate, 287 TeJ, 54 TrJ, 50 japonica intermediate, 21 Aus, and 24 intermediate. The details of classification and values of subpopulation component can be queried in Cultivar Information page.
Figure 1. Neighbor-joining tree of 1479 accessions constructed from matching distance of 188,637 even-distributed and randomly selected SNPs. Different subpopulations, indica I (IndI), indica II (IndII), Aus, temperate japonica (TeJ) and tropical japonica (TrJ) are shown in different color and the numbers of accessions in each subpopulation are marked. In this figure, the number of accessions of Intemediate contains VI group (denotes in purple).
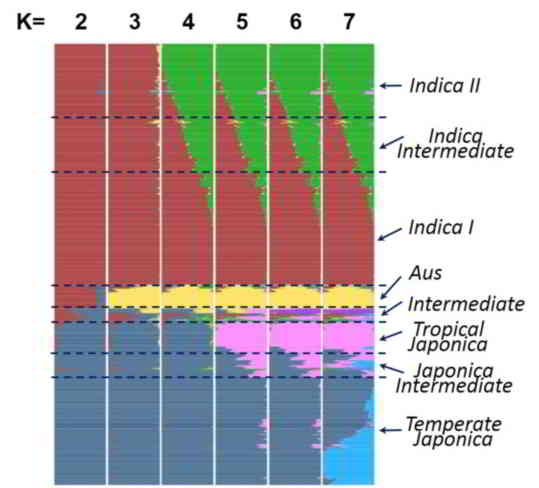
Figure 2. The distribution of the estimated subpopulation components for each accession analyzing by ADMIXTURE under different assumptions of ancient clusters K = 2 to 7 for 1479 accessions.
When K=2, accessions were divided into indica and japonica varietal groups.
At K=3, the aus cluster (Aus) appeared within the indica varietal group.
At K=4, the indica were further divided into two sub groups (indica I and indica II, also denote as IndI and IndII), indica accessions with similar components of IndI and IndII (<0.4) were classified as Indica Intermediate.
At K=5, japonica were divided into two sub groups, corresponding to tropical japonica (TrJ) and temperate japonica (TeJ), japonica accessions with similar components of TeJ and TrJ (<0.4) were classified as Japonica Intermediate.
At K=6, an independent group (VI) emerged, which is an intermediate group between indica and japonica. Only fourteen accessions belonged to VI and we found that nine of them were with mutated fragrance gene fgr, which suggested that VI is corresponding to Group V/Aromatic group reported in other studies (Glaszmann et al. Theor Appl Genet, 1987, 74: 21-30; 1. Garris et al. Genetics, 2005, 169: 1631-1638).
The set of 529 rice accessions sequenced in this study was accordingly classified into 98 IndI, 105 IndII, 92 indica intermediate, 91 TeJ, 44 TrJ, 21 japonica intermediate, 46 Aus, 14 VI, and 18 intermediate, and the set of 950 rice accessions sequenced by Huang et al. was divided into 283 IndI, 111 IndII, 120 indica intermediate, 287 TeJ, 54 TrJ, 50 japonica intermediate, 21 Aus, and 24 intermediate. The details of classification and values of subpopulation component can be queried in Cultivar Information page.

Figure 1. Neighbor-joining tree of 1479 accessions constructed from matching distance of 188,637 even-distributed and randomly selected SNPs. Different subpopulations, indica I (IndI), indica II (IndII), Aus, temperate japonica (TeJ) and tropical japonica (TrJ) are shown in different color and the numbers of accessions in each subpopulation are marked. In this figure, the number of accessions of Intemediate contains VI group (denotes in purple).