Tutorial of RiceVarMap v2.0
- 1. How to search for variations by region?
- 2. How to search for variations in a gene?
- 3. How to search genotype with variation ID?
- 4. How to search for polymorphic positions between two cultivars?
- 5. How to search for variation information with variation ID?
- 6. How to search cultivar information?
- 7. How to search phenotype information?
- 8. How to design primer by using RiceVarMap?
- 9. How to do haplotype network analysis?
- 10. How to convert RiceVarMap v1 ID to v2 ID (or v2 ID to V1 ID)?
RiceVarMap is a database that contains 17,397,026 variations (including 14,541,446 SNPs and 2,855,580 small INDELs ) of 4,726 cultivars all over the world.
The database provides various variation query functions (like 'Search for Variation by Region', 'Search for Variation in Gene' and 'Search for Genotype With Variation ID' et. al. ) and many useful analysis tools (like primer design tools, 'Design Primer by Region', 'Design Primer by Variation ID' and 'Haplotype Network Analysis' et. al.). All the variations are annotated by snpEff, CooVar, and ployphen2. The GWAS results and chromatin accessibility data from ATAC-seq are also used to curate the variation effects, all the significantly associated variations are saved in the database. Moreover, the query results are available for users to download through our website.
You can visit this version of RiceVarMap by entering its address http://ricevarmap.ncpgr.cn/v2. Background of data collection, processing and evaluation could be found in Notes and Data Evaluation page.
1. How to search for variations by region? top
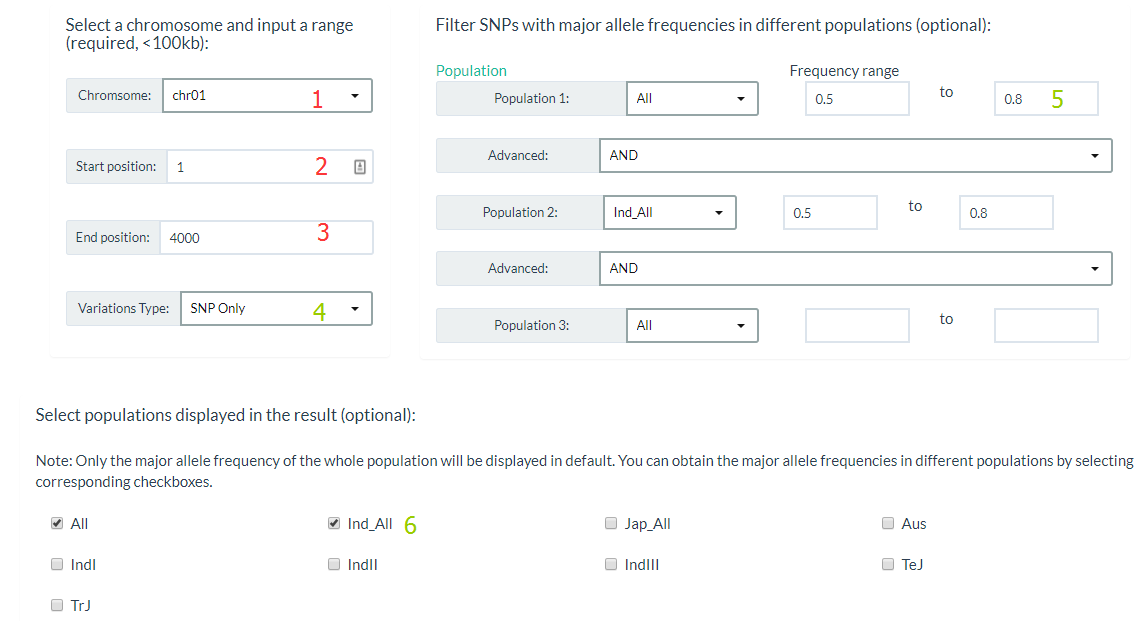
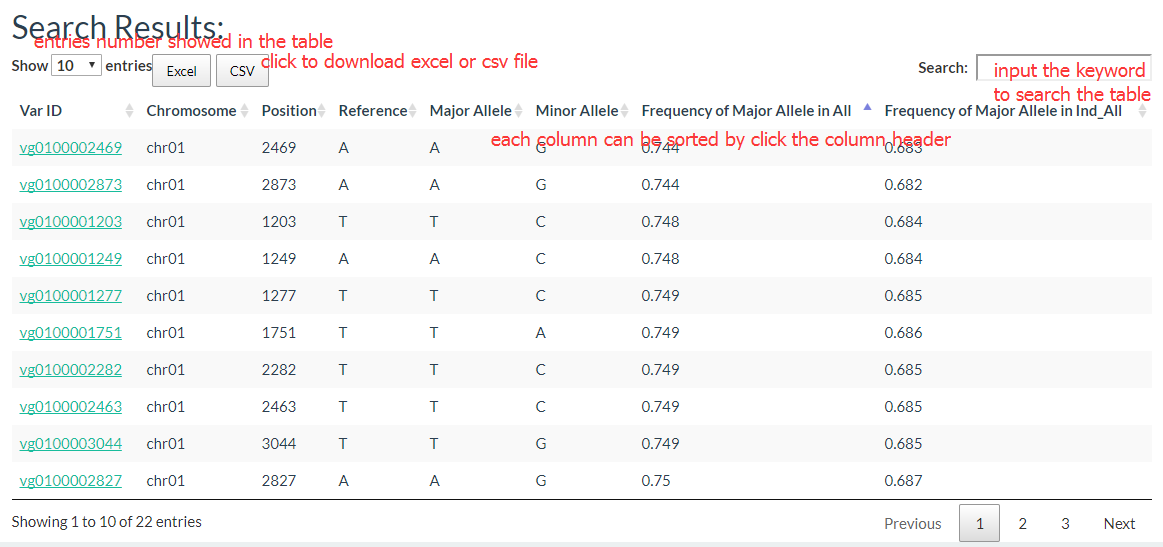
You can click this link, specify a chromosome and input a range (required), and also you can filter Variations by major allele frequencies (optional). For results display, you can select only output SNP or INDEL and populations major allele frequencies in this region.
The results show like this:
2. How to search for variations in a gene? top
You can click this link, enter one MSU Osal Rice Loci (e.g. LOC_Os01g01070), and if you want to search for variations in the upstream or downstream region, you can enter the upstream or downstream distance between the gene (e.g. upstream: 0.5kb, downstream 0.2kb, optional).

First, you can see a figure of variations distribution in this region, it can be zoom in or download.
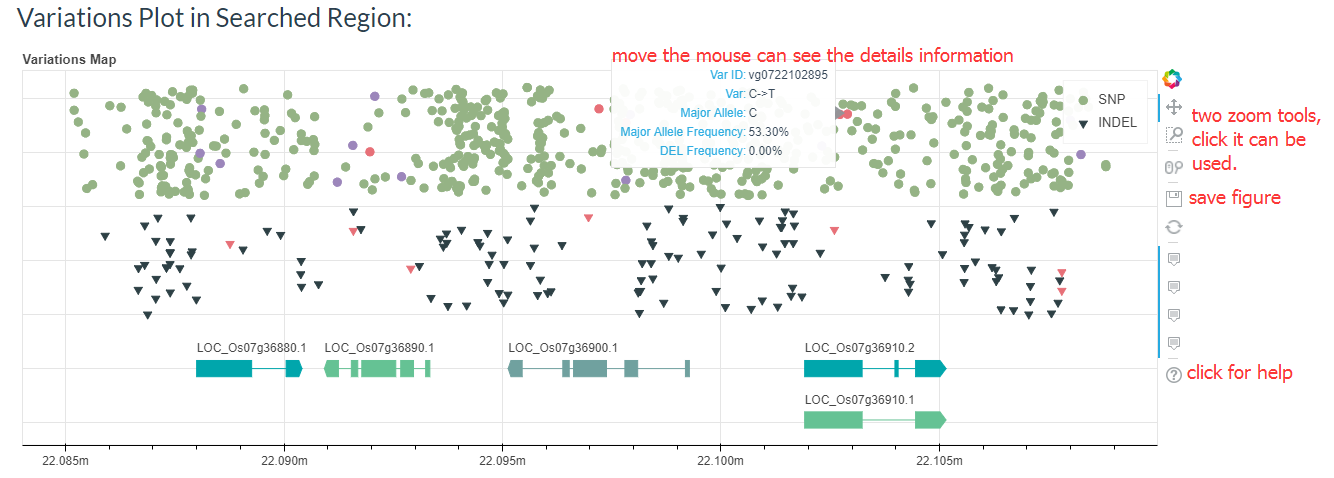
And the results table is also can be sorted and searched.
3. How to search genotype with variation ID? top
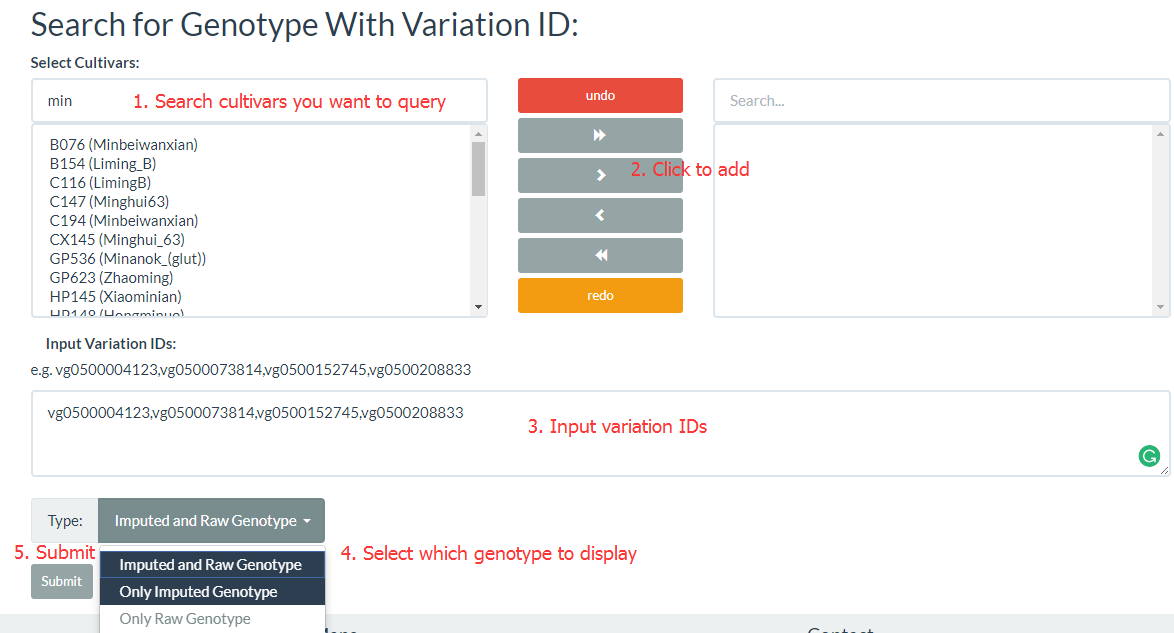
Firstly, you should collect variation IDs you need (you can find that in "search for Variations by region" page), and select "Variation Information" and click "Search for Genotype with Variation ID" (the link). Search and select cultivar name, click ">" (only add selected cultivars) or click ">>" (add all cultivars), enter variation IDs (e.g. vg0500004123,vg0500073814,vg0500152745,vg0500208833) , you can select only get the raw genotype (from the VCF file), only get imputed genotype (Imputed by an LD-KNN algorithm) or output imputed and raw genotype, and then click submit to get results.
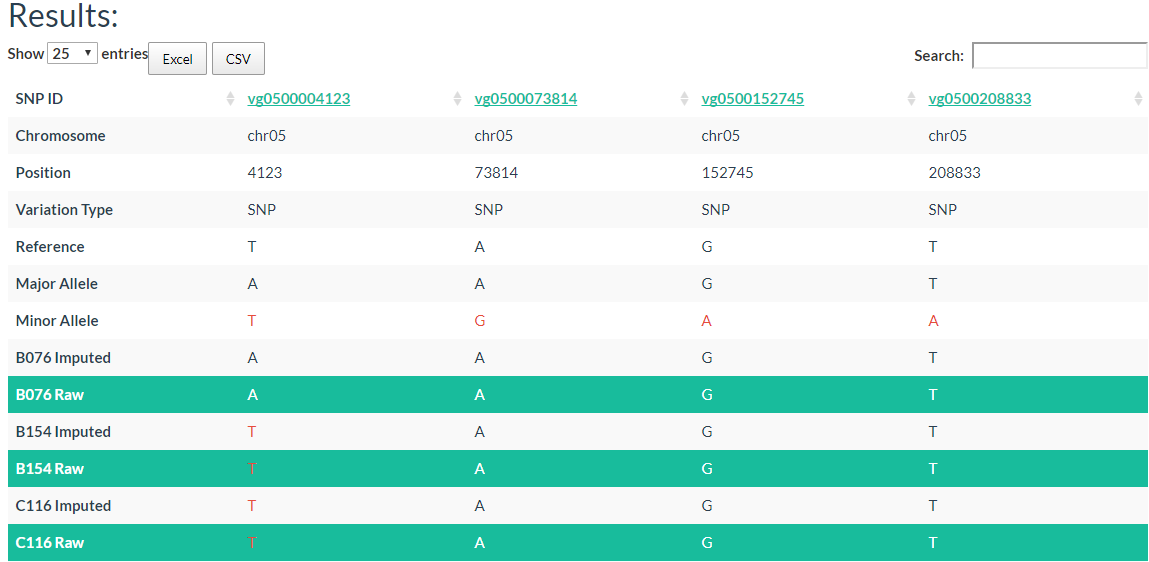
In the result table, each column represents one variation and chromosome, position, variation type (SNP?INDEL), reference allele, major allele and minor allele information are also listed out. The allele in red color means it is a minor allele, background color in green means it is the raw genotype (not imputed).
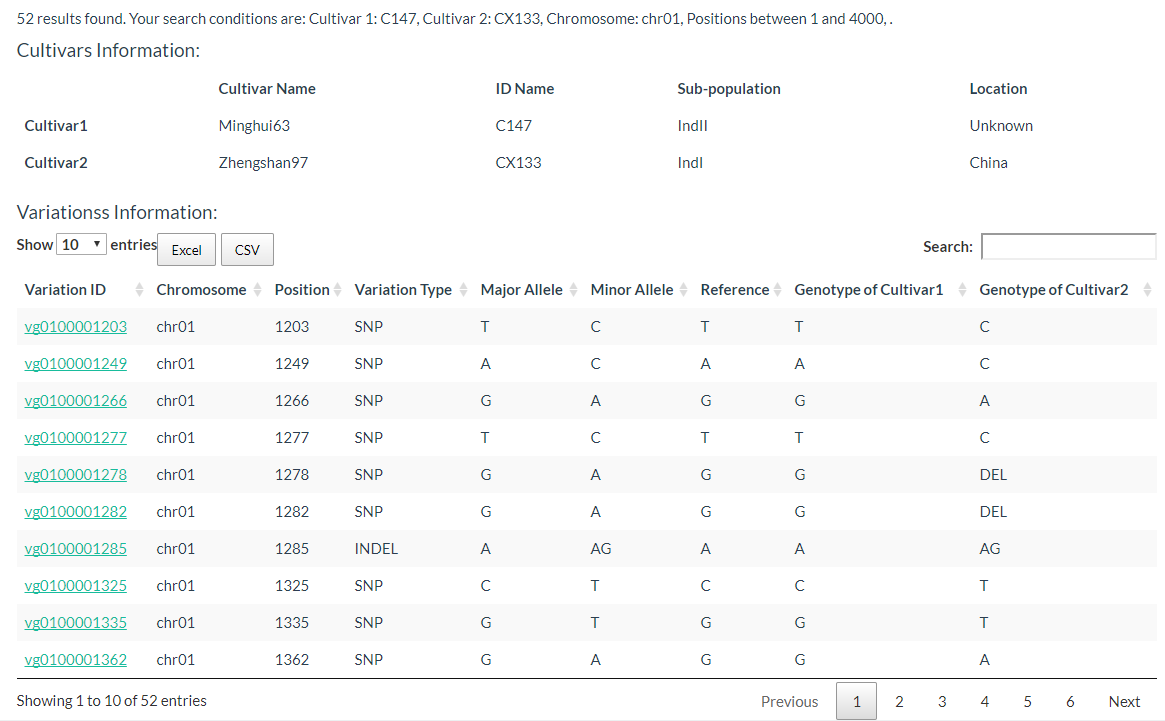
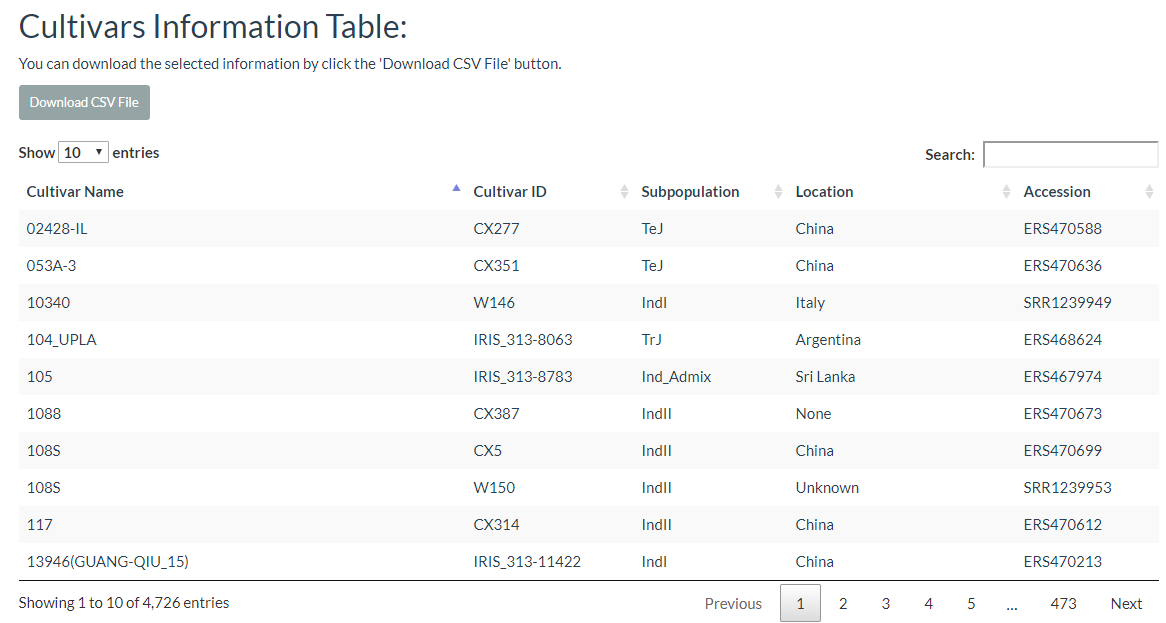
4. How to search for polymorphic positions between two cultivars? top
You can click this link, the cultivar can be searched by input the key word to reduce the selection time. The detailed steps are in the figure below:
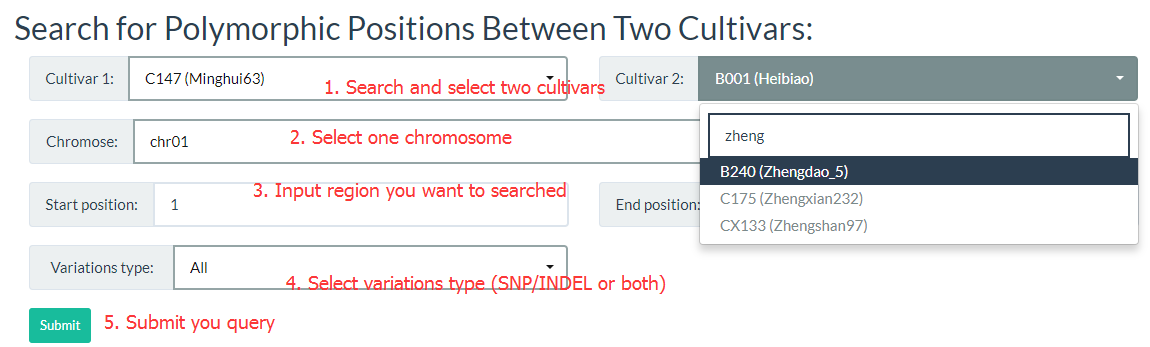
The results are two tables, the first is the cultivars information table, including cultivar name, ID name in the database, subpopulation information, and location information. The second table contains the genotype of two selected cultivars.
5. How to search for variation information with variation ID? top
In this link, you just need input one variation ID and can get the result.
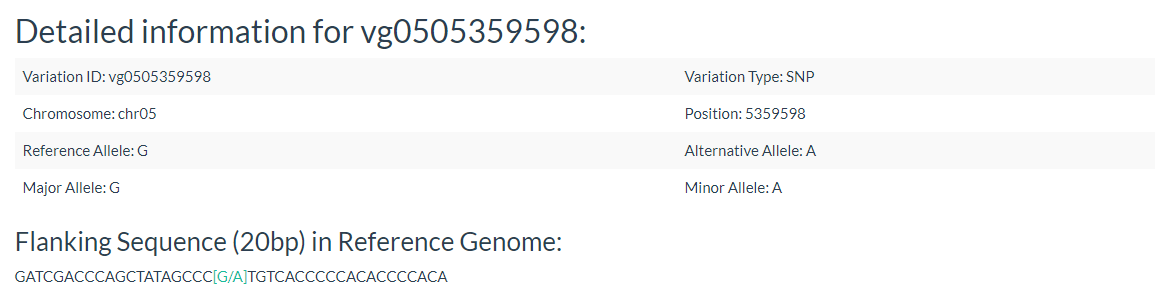
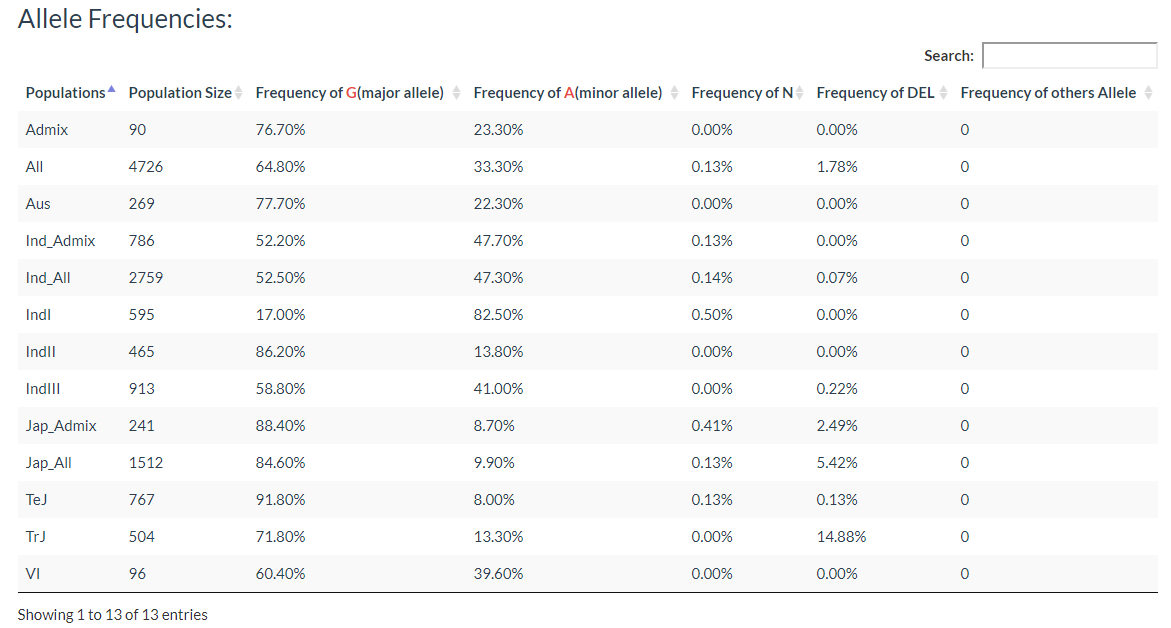
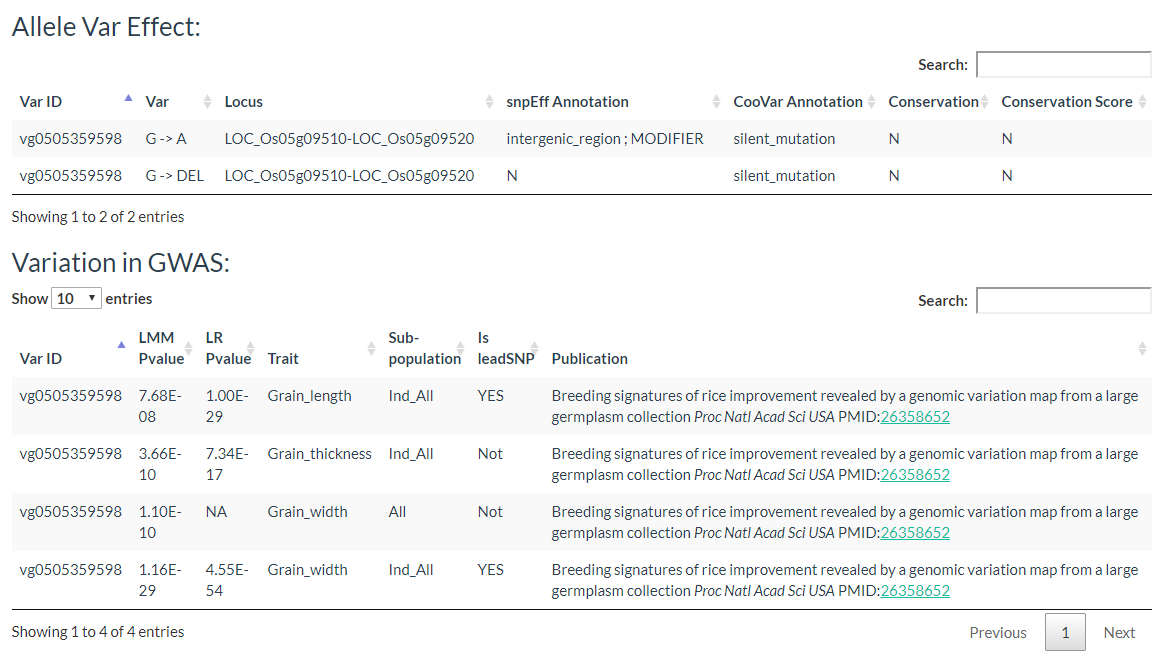
Results include the Flanking Sequence (20bp) around the variation, allele frequencies of each population. variation effect and the GWAS results of the variation.
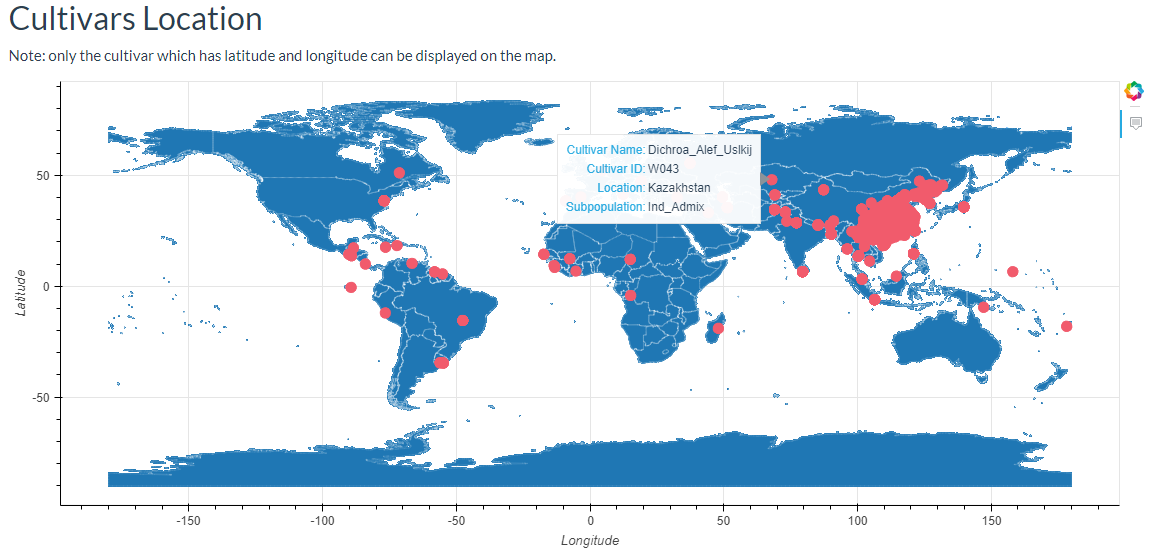
6. How to search cultivar information? top
In this link, cultivars can be selected and the results will output the cultivars location image and the detailed information table.
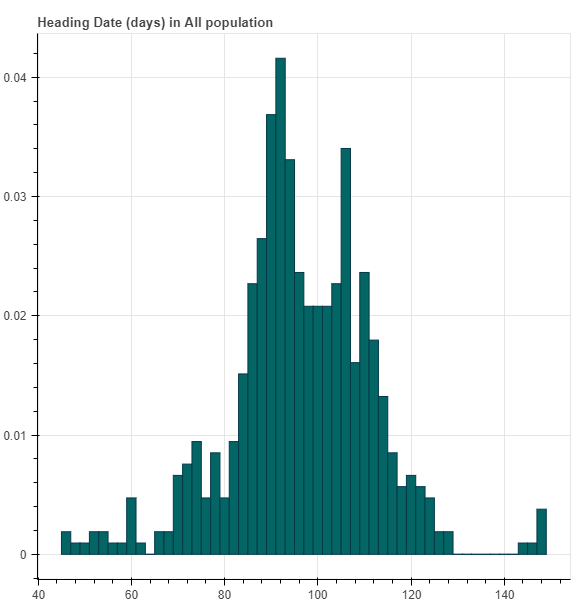
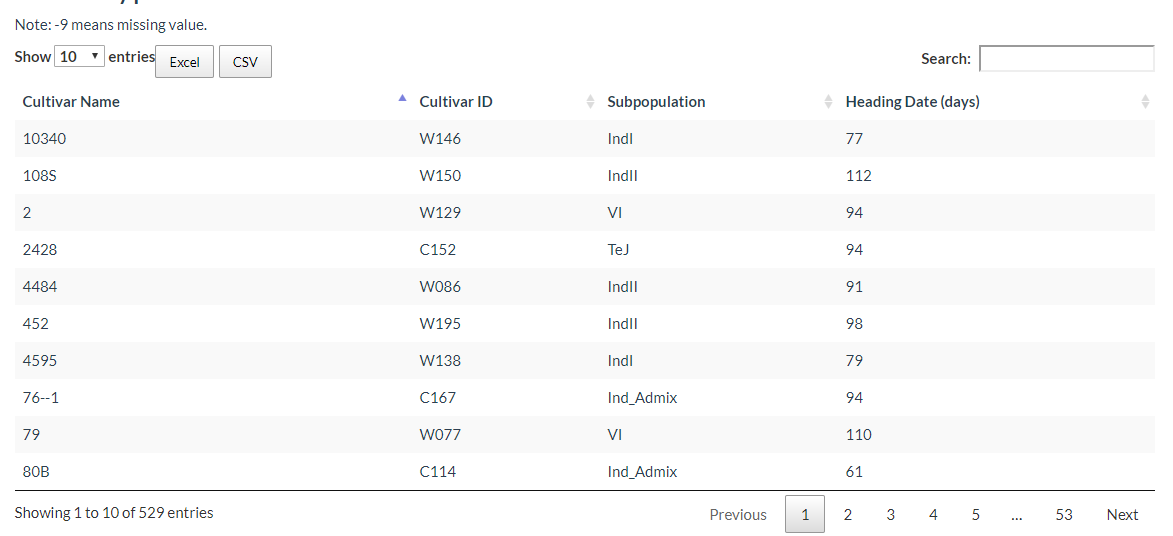
7. How to search phenotype information? top
By using this link, first, you should select one phenotype name, and then choose one population. Up to now, we collected 14 agronomic traits and three populations (All, Indica All and Japonica All).

For each phenotype, we first draw one phenotype distribution histogram plot.
And you can download phenotype information table for each cultivar:
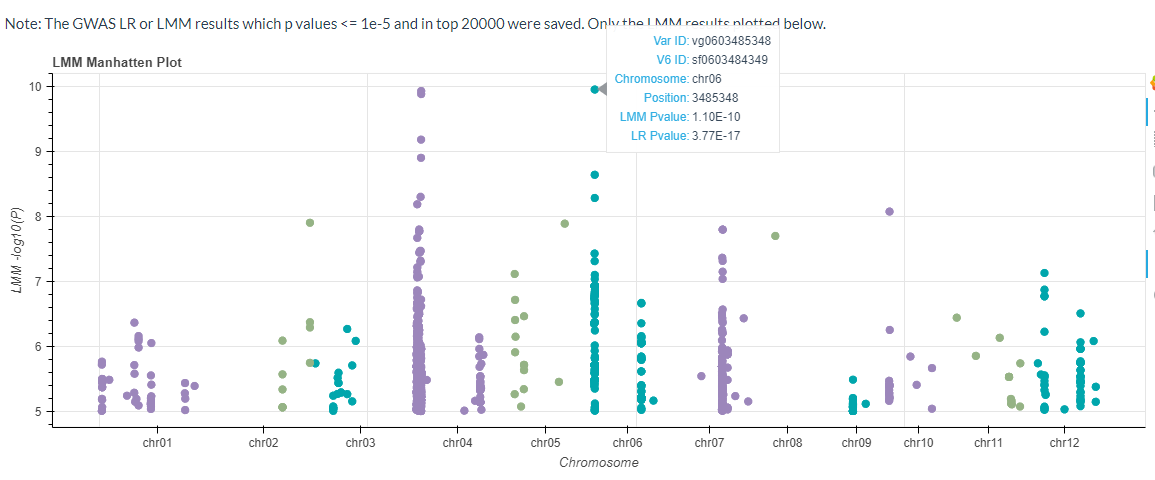
If the GWAS data available, the LMM model results will be plotted ( p values <= 1e-5 and in top 20000):
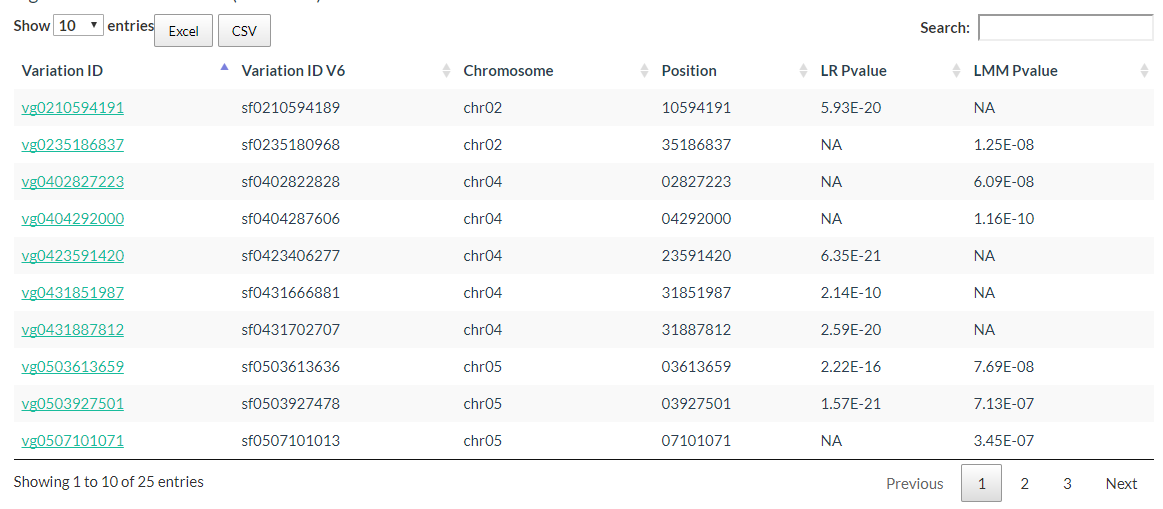
The Significant Candidate Loci information can be downloaded also.
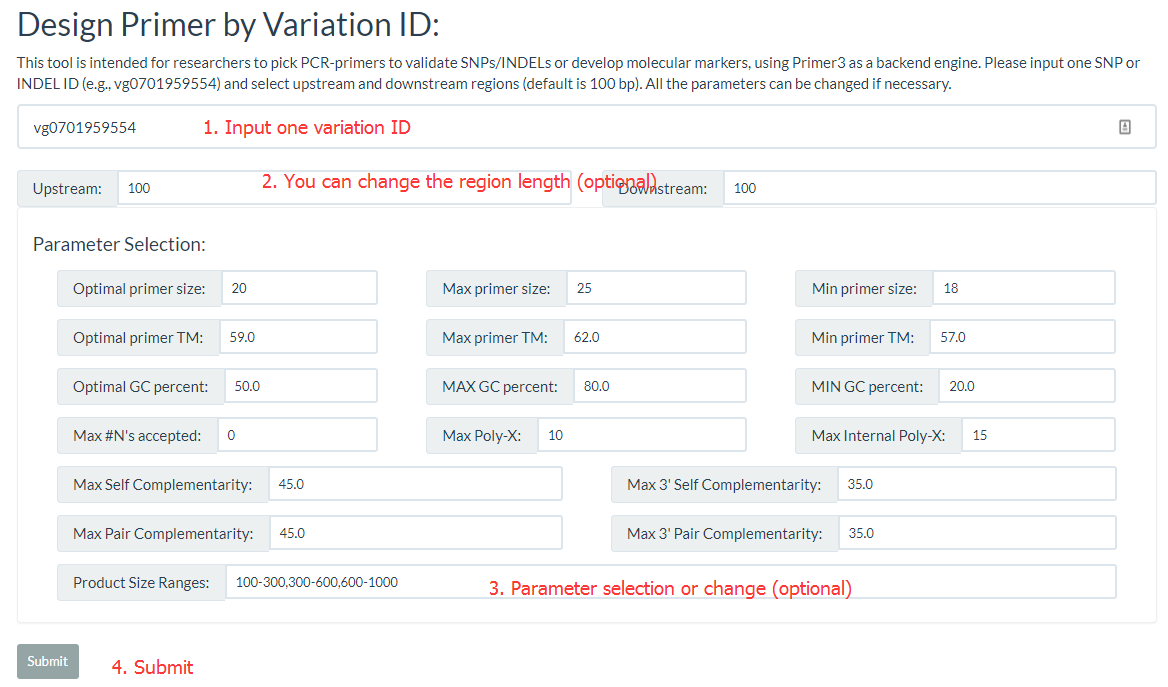
8. How to design primer by using RiceVarMap? top
'Design Primer by Variation ID' is intended for researchers to pick PCR-primers to validate SNPs/INDELs or develop molecular markers, 'Design Primer by Region' is intended for researchers to pick PCR-primers to amplify genomic regions avoiding to overlap with known SNPs/INDELs. They all Primer3 as a backend engine.
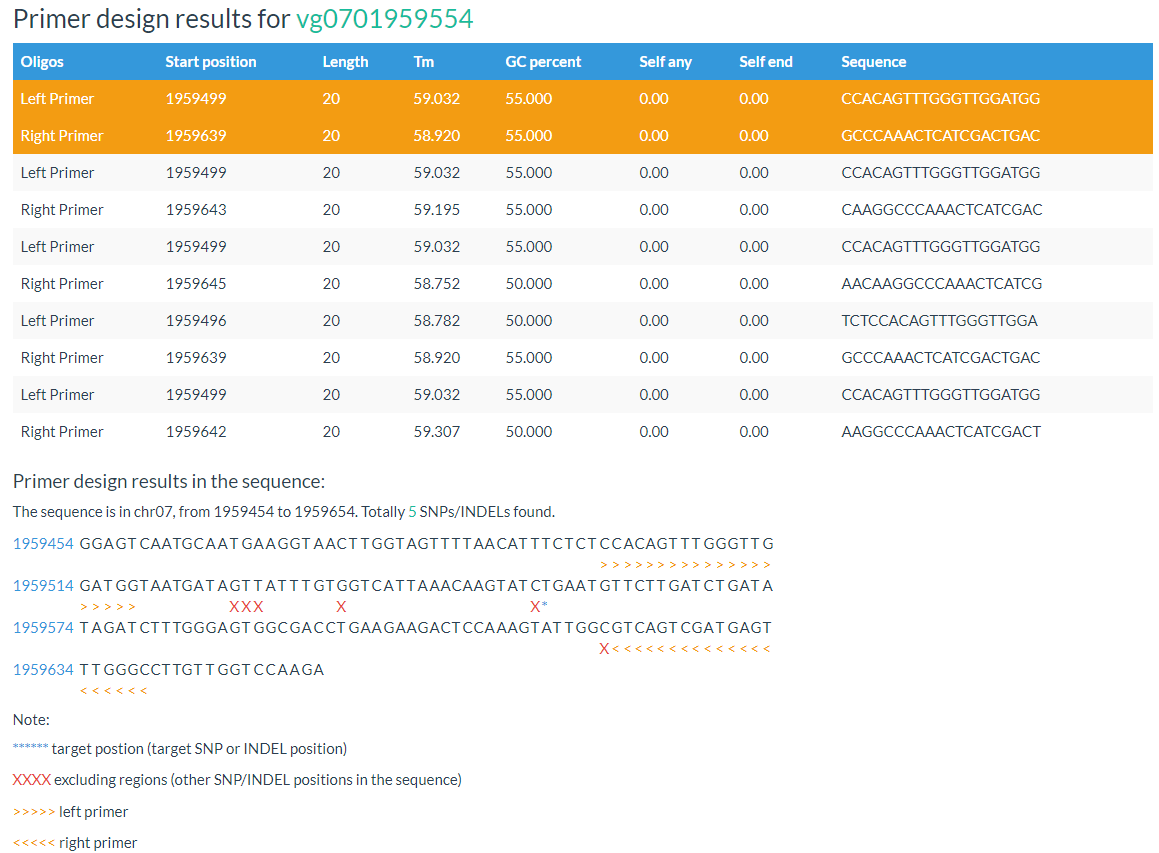
In result, the primer positions and variation position are marked out.
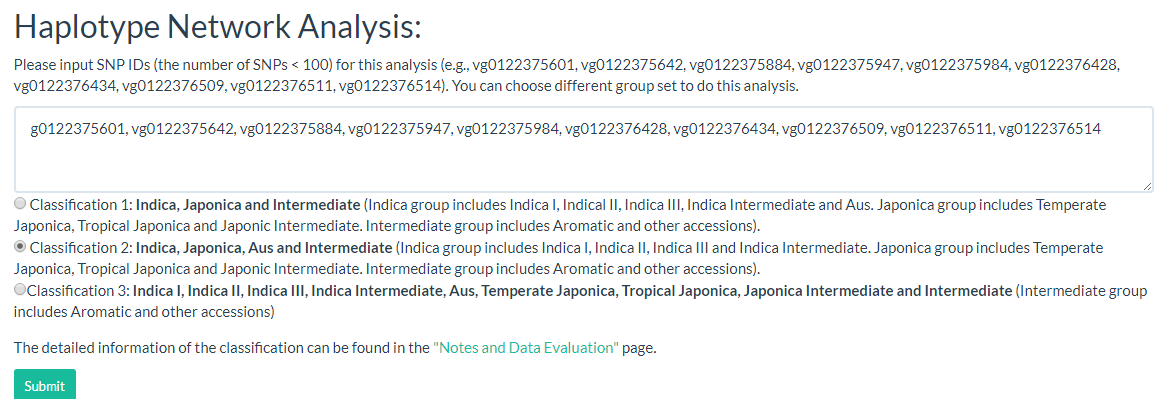
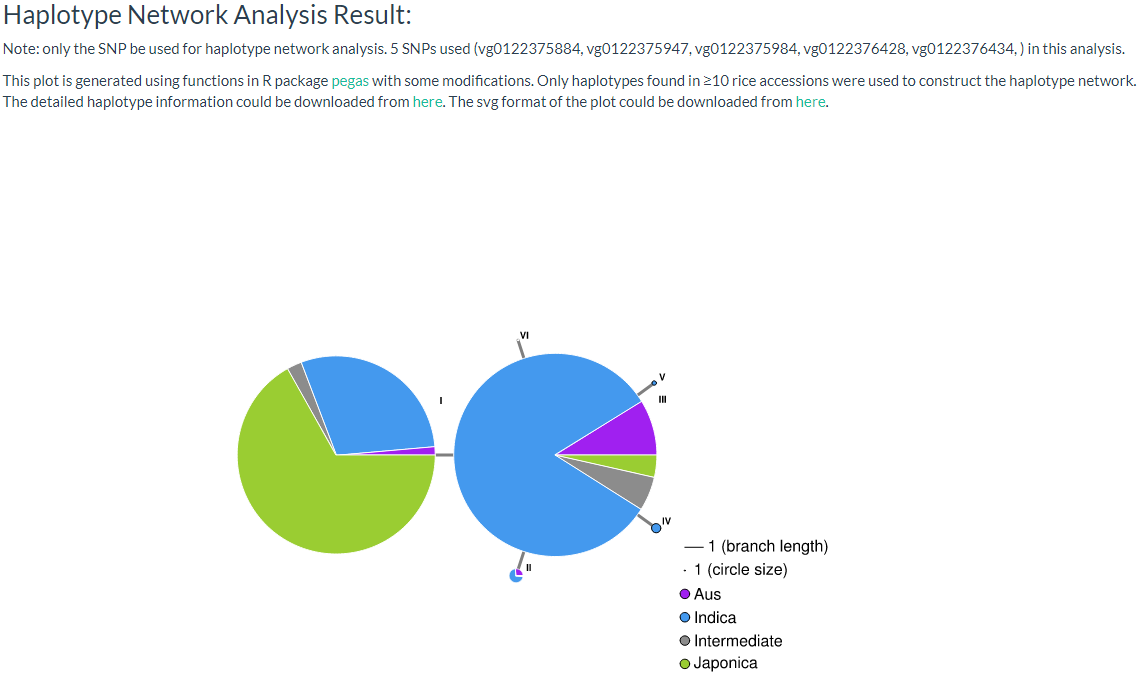
9. How to do haplotype network analysis? top
Haplotype network is frequently used in population genetic analysis, you can input selected variation IDs (must be SNP, INDELs will be filtered out) and select one population classification for haplotype analysis. and users can download CSV format and SVG file for further analysis (the page link).
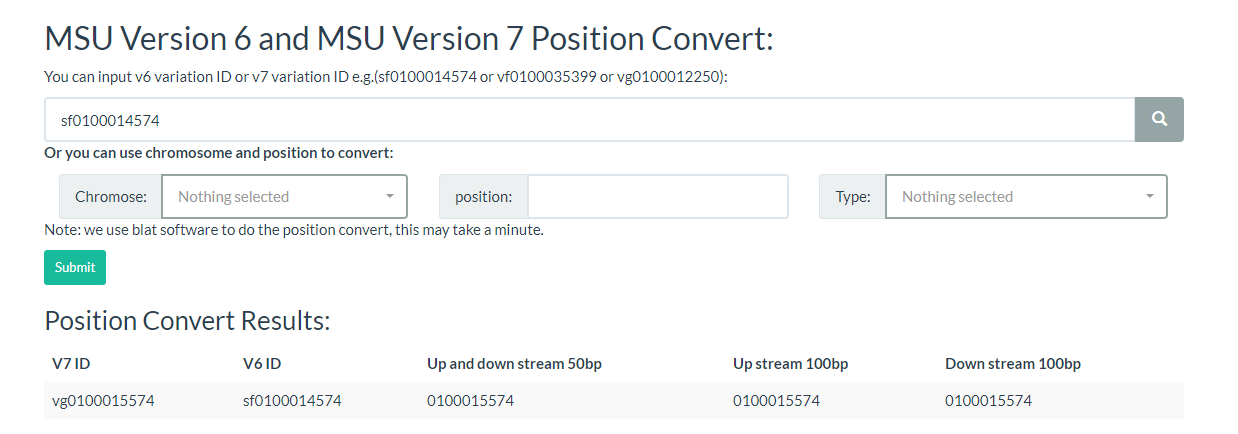
10. How to convert RiceVarMap v1 ID to v2 ID (or v2 ID to V1 ID)? top
You can just input one variation ID or the chromosome position or convert the variation ID on this page.